Site Speed and Google Site Ranking
In May 2020, Google announced that page experience signals would be included in Google Search ranking. Page experience is a set of signals that combines the Core Web Vitals with existing search signals (mobile-friendly, safe browsing, https, and no intrusive interstitials). This change is scheduled to take effect in May 2021. (Jose, 2020)
Google will continue to prioritize content in the search ranking, but in cases where content is of similar quality, the page experience will be more important to visibility in search. (Google Developers. n.d)
In addition to affecting ranking, Google also plans to add a visual indicator to highlight pages that rank well in experience. (Jose, 2020)
How does Google measure User Experience?
To help companies focus on metrics that matter the most to user experience, Google has defined a subset of their performance metrics as Core Web Vitals. (Walton, 2020)
Core Web Vitals focus on three aspects – loading, interactivity, and visual stability – and are measured with the following metrics:
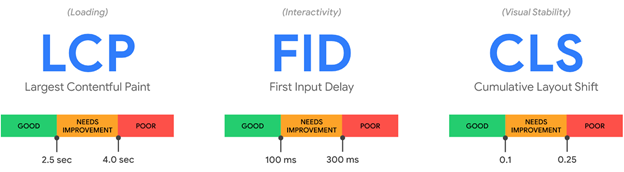
Images from https://web.dev/vitals/
Largest Contentful Paint (LCP) – measures how fast content appears on the page.
First Input Delay (FID) – measures how fast the page becomes interactive.
Cumulative Layout Shift (CLS) – measures unexpected layout shifts that might negatively impact user performance.
Where can I see experience metrics?
Google surfaces these vitals in all it’s popular tools including PageSpeed Insights, Search Console (Core Web Vitals Report), and Lighthouse. It should be noted that Lighthouse cannot report directly on First Input Delay, and Total Blocking Time (TBT) should be used instead. (Walton, 2019b)
PageSpeed Insights shows both a rolling 28-day average using field data and runs a Lighthouse report that gives a snapshot of current performance. It’s important to note that the rolling average is “Field Data” and the lighthouse report is “Lab Data”. Google makes a distinction between tools that use RUM (Real User Monitoring) and those that run in a synthetic environment. Field Tools include Google PageSpeed Insights and the Core Web Vitals Report in Google Search Console. Lab tools include Lighthouse and Google Dev Tools.
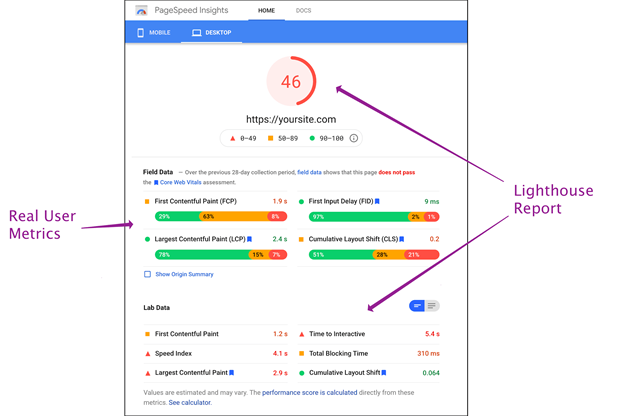
Field data is anonymized data from real-world users, so you get a wide sample of bandwidth, devices, and user interactions. Lab data, on the other hand, is run in a synthetic environment – for instance with a throttled CPU and/or throttled bandwidth. (Walton, 2019a)
When viewing the PageSpeed Insights report you may find a difference between the numbers reported in the field data and the lab data. This can be caused by a difference in characteristics between the real users (field data) and the simulated users that Lighthouse reports. For instance, the bandwidth of the field data users may be different from the throttled bandwidth in the Lighthouse report.
Another key difference between field data and lab data is the CLS metric. The lab tools record the CLS during page load. (Walton and Mihajlija, 2019). In the field data the CLS is accumulated until a page reaches unload. (Osmani, 2020). Because of the difference in recording, large differences between lab and field CLS data can point to user interaction issues.
If you have large differences between the lab data and field data, it may be difficult to calculate how improvements in lab data will impact field data. But keep in mind the lab data is very useful against itself. When you use Lighthouse against your development environments, you are able to measure how code changes impact performance. Similarly running Lighthouse on the same code base with different content can show you how content changes can improve performance metrics.
One last note on the difference between the Field Data and the Lab Data – the cumulative Lighthouse score includes 6 weighted metrics. The Core Web Vitals only includes two of these (FID being a metric that Lighthouse doesn’t report) and CLS only accounts for 5% of the Lighthouse score. So while you should aim for a good Lighthouse score, it is possible to have a poor Lighthouse score and be passing the Core Web Vitals assessment.
How Do I Improve My Score?
Beneath the Lighthouse scores is a list of suggestions to improve your scores. To improve your Core Web Vitals, you’ll want to focus first on suggestions that help FCP, CLS, and TBT (remember Lighthouse does not have FID, so you’ll look at this metric instead).
To improve FCP, remove or reduce render-blocking assets. The goal is to get the page to render as fast as possible and enhance progressively. This means prioritizing what is in and out of the “critical path” when loading the page. CSS and JS that is essential to the user experience on the page should be given top priority, and other assets deferred to load with a non-blocking method.
For CLS, you’ll want to look out for images that don’t have height and width specified (or use a method to block off space based on aspect ratio). Content that loads asynchronously can cause this if space is not reserved in the layout for the content. If you have poor performance in CLS in the field data, you should also check user interactions on the page using the profile in the Chrome Developer Tools. When CLS is recorded, intentional user actions like clicks are excluded, but scrolling and cursor movement are not, so pay particular attention to scroll and hover interactions when profiling. (Layout Instability Metric, n.d.) Also pay attention to the method you use for animations, using CSS transforms when animating elements on the page can avoid layout shift (Walton and Mihajlija, 2019)
For FID (or TBT), take a look at how busy your main thread is. Sites that load static content and then rehydrate the page can have issues in this area. Look at code-splitting, jettisoning unused code, and reducing third-party scripts.
Summary
When optimizing your site for the new page experience signals in Google Search, hone in on the three Core Web Vitals and make your decisions off the field data available in PageSpeed Insights and Google Web Console. Use Lighthouse data to measure improvements during development, but do not expect it to match your field data. And give yourself some runway, the field data is a 28-day average so large improvements will be tempered by past performance.
References
Explainer: Layout Instability Metric (n.d.) https://github.com/WICG/layout-instability#recent-input-exclusion
Google Developers. (n.d.) Understanding page experience in Google Search results, https://developers.google.com/search/docs/guides/page-experience
Jose, J. (2020). Timing for bringing page experience to Google Search. Google Developers. https://developers.google.com/search/blog/2020/11/timing-for-page-experience
Osmani, A. (2020). Does Cumulative Layout Shift stop measuring on user-interaction? [answer]. Stack Overflow. https://stackoverflow.com/questions/62722217/does-cumulative-layout-shift-stop-measuring-on-user-interaction)
Walton P. and Mihajlija, M. (2019). Cumulative Layout Shift (CLS). web.dev. https://web.dev/cls/)
Walton P. (2020) Web Vitals. web.dev https://web.dev/vitals/
Walton P. (2019a) User-centric performance metrics. Web.dev. https://web.dev/user-centric-performance-metrics/#how-metrics-are-measured
Walton, P. (2019b). First Input Delay (FID). web.dev. https://web.dev/fid/